Analytics of the present relies on information being delivered accurately and in the appropriate format. But business data in most cases hops from one application to another. In a typical scenario, there are several applications, dashboards, APIs, data warehouses, and pipelines present in the cycle. If one link within the chain breaks, reports can still be created, but whether they will be correct and updated is a matter of luck.
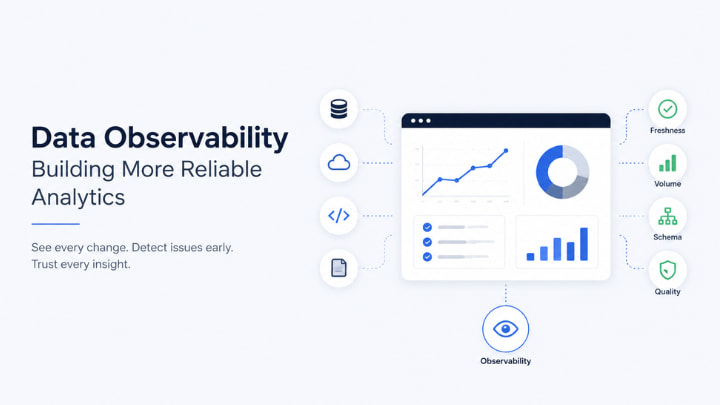
Data observability solves the issue of data integrity. It is by keeping track of data health within the highly dispersed ecosystems of business data usage and high frequency report generation.
According to the research conducted by Data Intelo, the market of database observability had a value of 8.2 billion dollars in 2025 and is going to increase up to 21.4 billion dollars by 2033, with a compound annual growth rate of 12.8% from 2026 to 2033.
The importance of data quality in reliable analytics
Having reliable analytics goes beyond just having your dashboard operational. You can have the dashboard load in a couple of seconds; still, it can have incorrect results if 8% of the table records are missing. Data observability looks at aspects such as the freshness, volume, distribution, schema, lineage, and quality of the data.
Research from Gartner estimates the cost of low data quality at $12.9 million every year for a company. Even with just a 1% error rate in a large dataset, thousands of records can be influenced when you have millions of transactions processed by a company monthly.
Identifying issues in dashboards
Conventional data testing may only be performed every 24 hours, creating a considerable gap for undetected problems. Continuing observation gives a constant monitoring with automated notifications and minimizes the gap until detection.
To illustrate, an occurrence with a customer table receiving 500,000 records daily but suddenly receiving only 420,000 at one point can be picked up by a volume monitor which should identify the decrease of 16%. A freshness checker can catch the pipeline delayed by 4 hours instead of the usual 30 minutes.
Subsequently, analysts will have time to investigate the problem prior to wrong figures being distributed through reports.
Improved root cause analysis
Mitigating a data issue is merely part of the challenge. The next obstacle is discovering the data’s origin.
Data observability involves using lineage and dependency mapping to ascertain the connection of reports with transformations, tables, pipelines, and source systems. Take, for instance, a revenue report that shows a 7% dip in revenue. In the absence of lineage, an analyst would investigate numerous reports. Because of the visibility to dependencies, the analyst can pinpoint the specific transformation that changed three upstream fields, or a source feed that stopped updating at 09:20.
By swiftly diagnosing the problem, wasted hours of an analyst’s time can be avoided, as well as subsequent decisions made using unreliable data.
Same metrics from various departments
Different departments may utilize different definitions for the same metric such as active customers, for example, one department may count customers as active if they made any transaction within 30 days while the other department may count a customer as active if he/she made a purchase during the last 90 days. The process of observability helps detect these discrepancies through monitoring datasets, processes, owners, etc.
The trustworthy analytical environment can enable establishing checks which can be used for revenue, conversion rate, inventory, and number of customers metrics. If one of the calculations is changed by 12% overnight without any business event that enables a qualified person to detect the anomaly which creates the solid basis for regulation without slowing down the routine analytical processes.
Mitigating operational risk
The occurrence of an uncontrollable pipeline may not trigger a quick shutdown of the system but can result in misleading financial statements and projections and cause scams and regulatory reports. In 2025, the worldwide average loss from data breaches reached $4.44 million, which, in turn, underlines the financial damage inflicted by unprotected data and inadequate security measures.
Data observability does not eliminate the necessity of cybersecurity and governance. What it does is provide an oversight of the operations. The ability to monitor changes in structure over tim and witnesses unusual trends in the level of data volume.
How Data Observability improves analytics reliability?
It can be learned by a table diagram given below.
| Reliability area | Example signal | Potential business effect |
| Freshness | 4-hour delivery delay | Stale dashboards |
| Volume | 16% record drop | Missing transactions |
| Schema | 3-field change | Broken transformations |
| Distribution | 12% metric shift | Misleading trends |
| Lineage | 5 downstream reports | Faster impact assessment |
Scaling with growing data complexity
As the data environment grows, the need for observability increases. A business with 50 data pipelines presents a completely different set of monitoring challenges than one with 500 or 5,000. The increase in sources leads to a rise in dependencies and with every dependency comes a possibility of failure.
Cloud data warehouses, streaming systems, machine learning processes, and generative AI projects increase complexity. With data layers getting updated every few minutes, manual verification turns out to be unfeasible. Nevertheless, automated monitoring can analyze hundreds of events at any moment in time and score anomalies based on the possible business impact.
Creating a strong analytics culture
The availability of technology does not mean a company will create reliable analytics. Ownership along with defined rules of quality is important for analytics.
- Assign persons responsible for datasets.
- Determine the thresholds of data quality and amount of subject to consideration.
- Classify incidents by severity.
For instance, a 5 minutes delay in the case of a report of the lowest priority is a subject to no immediate action whereas a delayed financial transaction could be very serious. The teams will concentrate their efforts on the most valuable data sets.
Conclusion
An important aspect of the value of observability of data is creating conditions of understanding and measuring its behavior. By identifying anomalies at an earlier stage, understanding relationships faster, and creating standards for checking reliability, companies will avoid making wrong decisions because of the lack of data.
As the analytics environments change from dozens to hundreds or thousands of components connected with each other, observation becomes a prerequisite for successful reporting and decision-making. This thing is going to stay.